
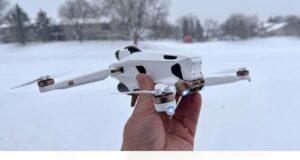
How the AntiGravity A1 Is Transforming Agricultural Decision-Making Across India
Indian agriculture operates across a scale and geographic diversity that make the information problem its fundamental challenge.
A farmer managing two hundred acres of wheat cannot see most of those acres from any single vantage point. The section of the field where irrigation coverage is uneven looks the same from the ground as the section where coverage is optimal—until the difference becomes visible in crop health, by which point the opportunity for early intervention has passed. The pest infestation that begins in one corner of a large field spreads across fifty acres before anyone walking the field boundaries discovers it.
The information that would allow better agricultural decisions—the spatial distribution of crop health across the full field area, the irrigation coverage uniformity, and the early identification of stress, pest pressure, and disease before these problems reach the scale where they are visible from the field boundary—is aerial information. It is information that requires looking down at the field from above rather than walking through the field looking across at crop height level.
The AntiGravity A1, deployed by VR Ashwa for agricultural monitoring applications, provides this aerial information at the resolution and the analytical quality that makes it genuinely actionable for agricultural decision-making rather than visually interesting but practically limited.
Why Agricultural Monitoring Requires More Than Visual Photography
The agricultural drone application that provides the most immediate and most commercially significant value for Indian farmers and agribusinesses is not standard visual photography — it is the combination of multispectral imaging and thermal imaging that reveals crop health information that the human eye cannot detect in standard visual imagery.
Multispectral imaging captures reflected light across wavelengths beyond the visible spectrum—the near-infrared range where healthy chlorophyll-rich vegetation reflects strongly and stressed or diseased vegetation reflects differently in ways that create the spectral signatures that vegetation health analysis detects.
The NDVI map—the Normalized Difference Vegetation Index output from multispectral analysis—shows the spatial distribution of crop health across the entire field area in a color-coded overlay that makes field management zones immediately visible. The high-health green areas. The moderate-stress yellow transition zones. The significant-stress red areas that require immediate intervention assessment.
This spatial information transforms crop management from reactive—responding to problems that are already visible and already large—to proactive—identifying and intervening in areas of developing stress before the stress reaches the scale where it causes significant yield loss.
The Irrigation Management Application
Water is India’s most critical agricultural resource and its most frequently mismanaged one—not through lack of concern but through lack of information. The farmer who does not know which sections of their fields are being under-irrigated and which are being over-irrigated cannot make the irrigation management adjustments that would improve both water efficiency and crop uniformity.
Aerial thermal imaging of irrigated fields reveals the temperature differences that correspond to irrigation coverage differences — under-irrigated areas are warmer, well-irrigated areas are cooler, and the spatial pattern of these temperature differences maps directly to the spatial pattern of irrigation coverage uniformity across the field.
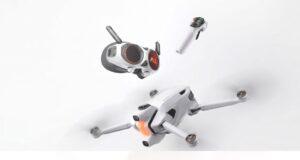
This thermal irrigation mapping, conducted regularly throughout the growing season, provides the specific irrigation management information that drip system optimization, sprinkler coverage adjustment, and flood irrigation improvement require. The water savings that result from optimized irrigation management based on accurate thermal mapping—reduced water use, reduced pumping costs, and improved crop uniformity—represent direct economic value that the aerial monitoring investment generates.
Pest and Disease Early Detection
The early detection of pest infestation and disease outbreak before these problems spread beyond the initial infection points is the agricultural application where aerial monitoring creates the highest economic return—because the treatment cost of a small, early-detected problem is a fraction of the yield loss cost of the same problem discovered late.
Multispectral analysis detects the spectral changes in plant tissue that precede visible symptoms of many common Indian crop diseases and pest infestations. The fields that look uniformly healthy to the walking inspector may show early-stage stress signatures in multispectral imagery that flag specific zones for ground investigation.
This early flag—the identification of zones showing early spectral stress signatures before the problem is visible—allows targeted ground investigation and early intervention that prevents the problem from spreading to the economically significant scale that late detection requires treating at full extent.
Crop Estimation and Harvest Planning
The aerial coverage of crop fields at key growth stages provides the data for crop estimation — the assessment of expected yield from the visible crop condition across the full field area — that agricultural commodity trading, harvest planning, and storage logistics all require.
High-resolution AntiGravity A1 imagery at flowering and grain-fill stages provides the crop condition data that experienced agronomists use to develop yield estimates with a spatial accuracy that ground sampling cannot replicate across large field areas.
The VR Ashwa Agricultural Monitoring Service
VR Ashwa provides AntiGravity A1 agricultural monitoring services across India’s major agricultural regions—the wheat and rice belts of North India, the cotton and sugarcane areas of Maharashtra and Gujarat, the horticultural areas of Himachal Pradesh and Karnataka, and the plantation crops of Kerala and Tamil Nadu.
The service includes the aerial data collection, the multispectral and thermal analysis processing, and the agronomic interpretation reports that make the aerial data actionable for the farmers and agribusiness managers who need to act on it.
📞 +91-9811885503 | +91-9953636109 — Agricultural monitoring enquiries welcome at any hour. 🌐 www.vrashwa.com
Better agricultural information produces better agricultural decisions. The AntiGravity A1 provides the information. VR Ashwa delivers it wherever your fields are.